Launching Lookout
July 30th, 2026
We’re launching Lookout, a platform for unifying and sharing public health data.
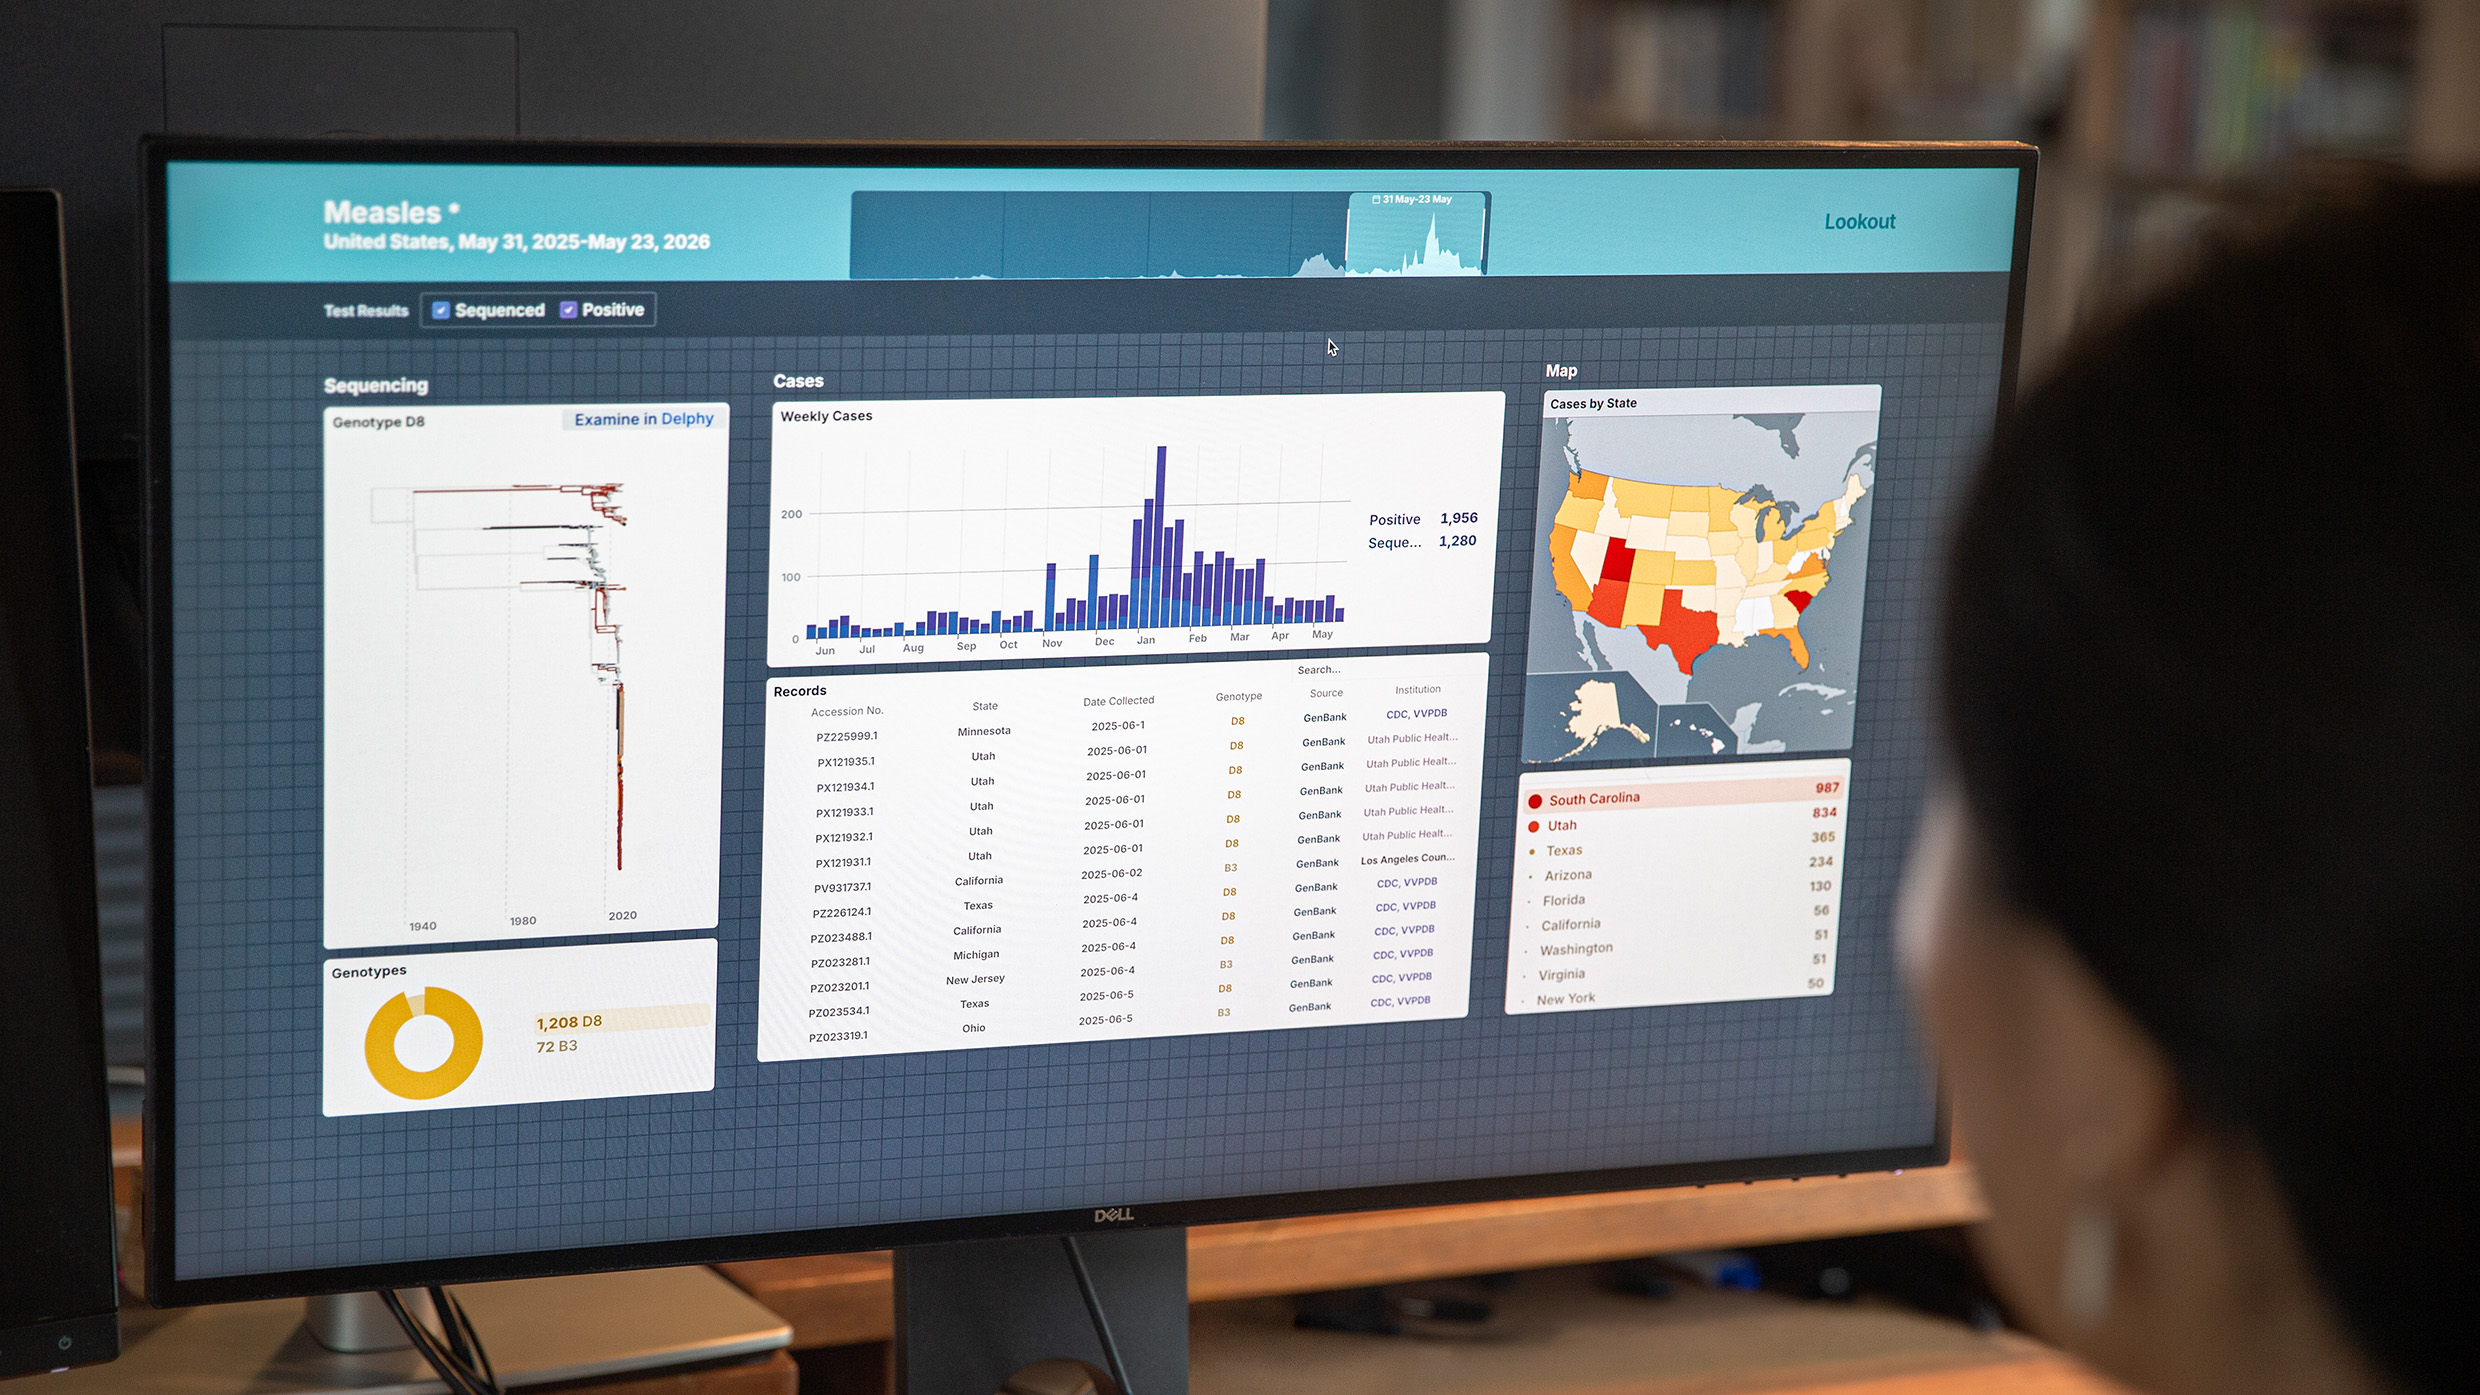
Lookout is a pathogen surveillance tool designed to help public health workers monitor and respond to outbreaks—built in direct response to the data challenges we’ve encountered over and over again in our years of working with on-the-ground response teams.
Over the last seven years, our work has focused on empowering local communities to conduct their own infectious disease surveillance work. We’ve explored a number of ways to equip our partners with the tools they need to make sense of the complex and varied pieces of information that reveal what’s happening in an outbreak.
Response time is crucial in combating an outbreak. The priority is to quickly identify where, when, what, and how bad an emerging threat might be, and to use that understanding to make informed decisions about how to distribute limited resources most effectively.
Working with all the data you have.
There will never be a single data source that presents the full picture of an outbreak. Response teams are often working with scrappy and incomplete datasets that need to be pieced together to provide any meaningful insights. As this data is often collected from multiple sources and stored in different formats, aggregating it is often a time-consuming process.
By bringing epidemiological, genomic, and clinical data together into a single interactive platform, Lookout is able to serve as a single point of reference across all branches of a response effort.
Lookout focuses on making it as easy as possible to work with what you actually have.
The Lookout data format reduces the amount of time spent on managing data pipelines and allows for new data sources to be added in as they become available. Setting up and maintaining a Lookout view can be as simple as writing a simple script to preprocess data into the Lookout format, and configuring a few JSON files guided by our technical documentation.
Visualization as a tool for understanding outbreaks.
Epidemiologists, researchers, and public health workers already know the types of visual representations that are most helpful in an outbreak scenario. It should be more or less automatic to generate epi curves, phylogenetic trees, and choropleth maps—and in Lookout, it is simple to display your data with those charts, without needing to write custom code or budget for clunky chart-building software.
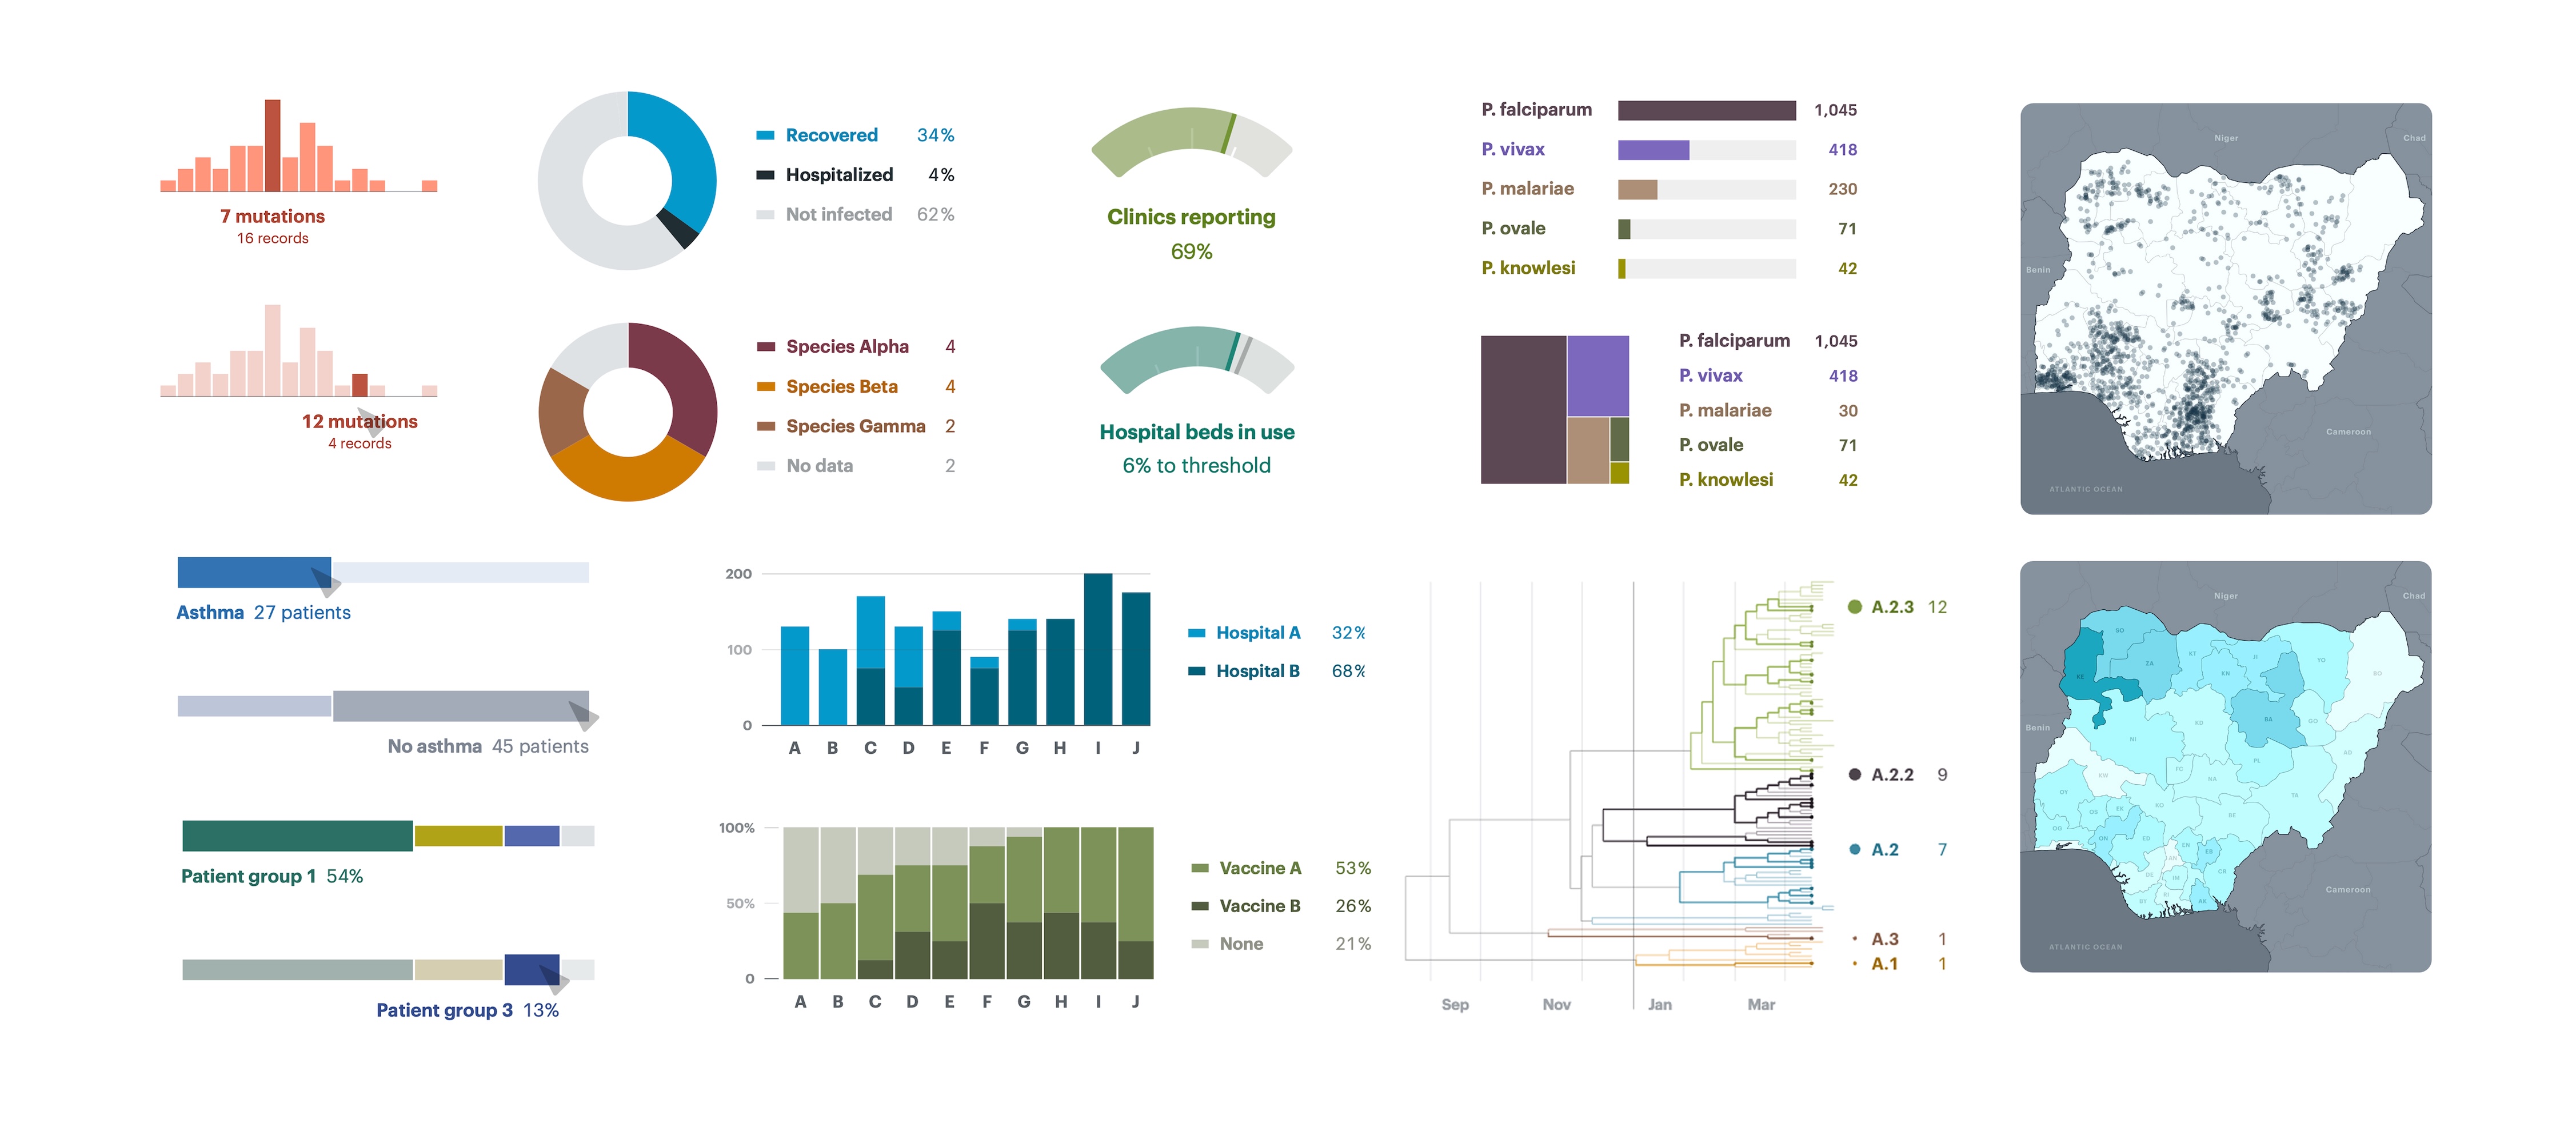
The challenge isn’t about getting charts into a dashboard, it’s about building visual systems that allow teams to quickly explore different subsets of their data, ask questions, locate unusual trends, and share these insights with others. What’s changing? How is it moving over time and space? What actions do we need to take next?
Lookout approaches this problem by centering interactivity. Researchers can narrow down to specific time ranges, locations, pathogens, lineages, or metadata fields to discover patterns and causality in the data.
Deploying Lookout.
We designed Lookout to be compatible with any existing infrastructure.
Our partners in West Africa are often working in low-resource settings, where steady WiFi connections, IT departments, and high-capacity servers are not guaranteed. Alternatively, higher-resource public health systems we’ve worked with in the United States often have layers of bureaucracy that can make it slow to implement new systems. In an outbreak, public health agencies at any scale need something they can quickly adapt and deploy.
The Lookout code is a static bundle of HTML and JavaScript files that can be served from whatever infrastructure is already in place. Lookout itself has no back-end requirements, making it very simple to set up a view, even if only a single laptop is available. It can also be set up with a more complex back-end in cases where access control or user authentication is crucial. This keeps data within the user’s own system, so sensitive data never needs to leave its secure environment.
Lookout is free and open source. Public health data is sensitive, so we made the source code available for those who want (or need) a closer look.
Setting up new software and taking the time to train individuals to use it is an investment. Teams want to be confident that the tools they rely on to conduct their public health work won’t disappear at the whim of third-parties—or be subject to increasing fees.
What’s next?
Lookout provides an important baseline for collecting, viewing, and sharing outbreak information, but we want to continue to improve the ways in which Lookout can support response efforts.
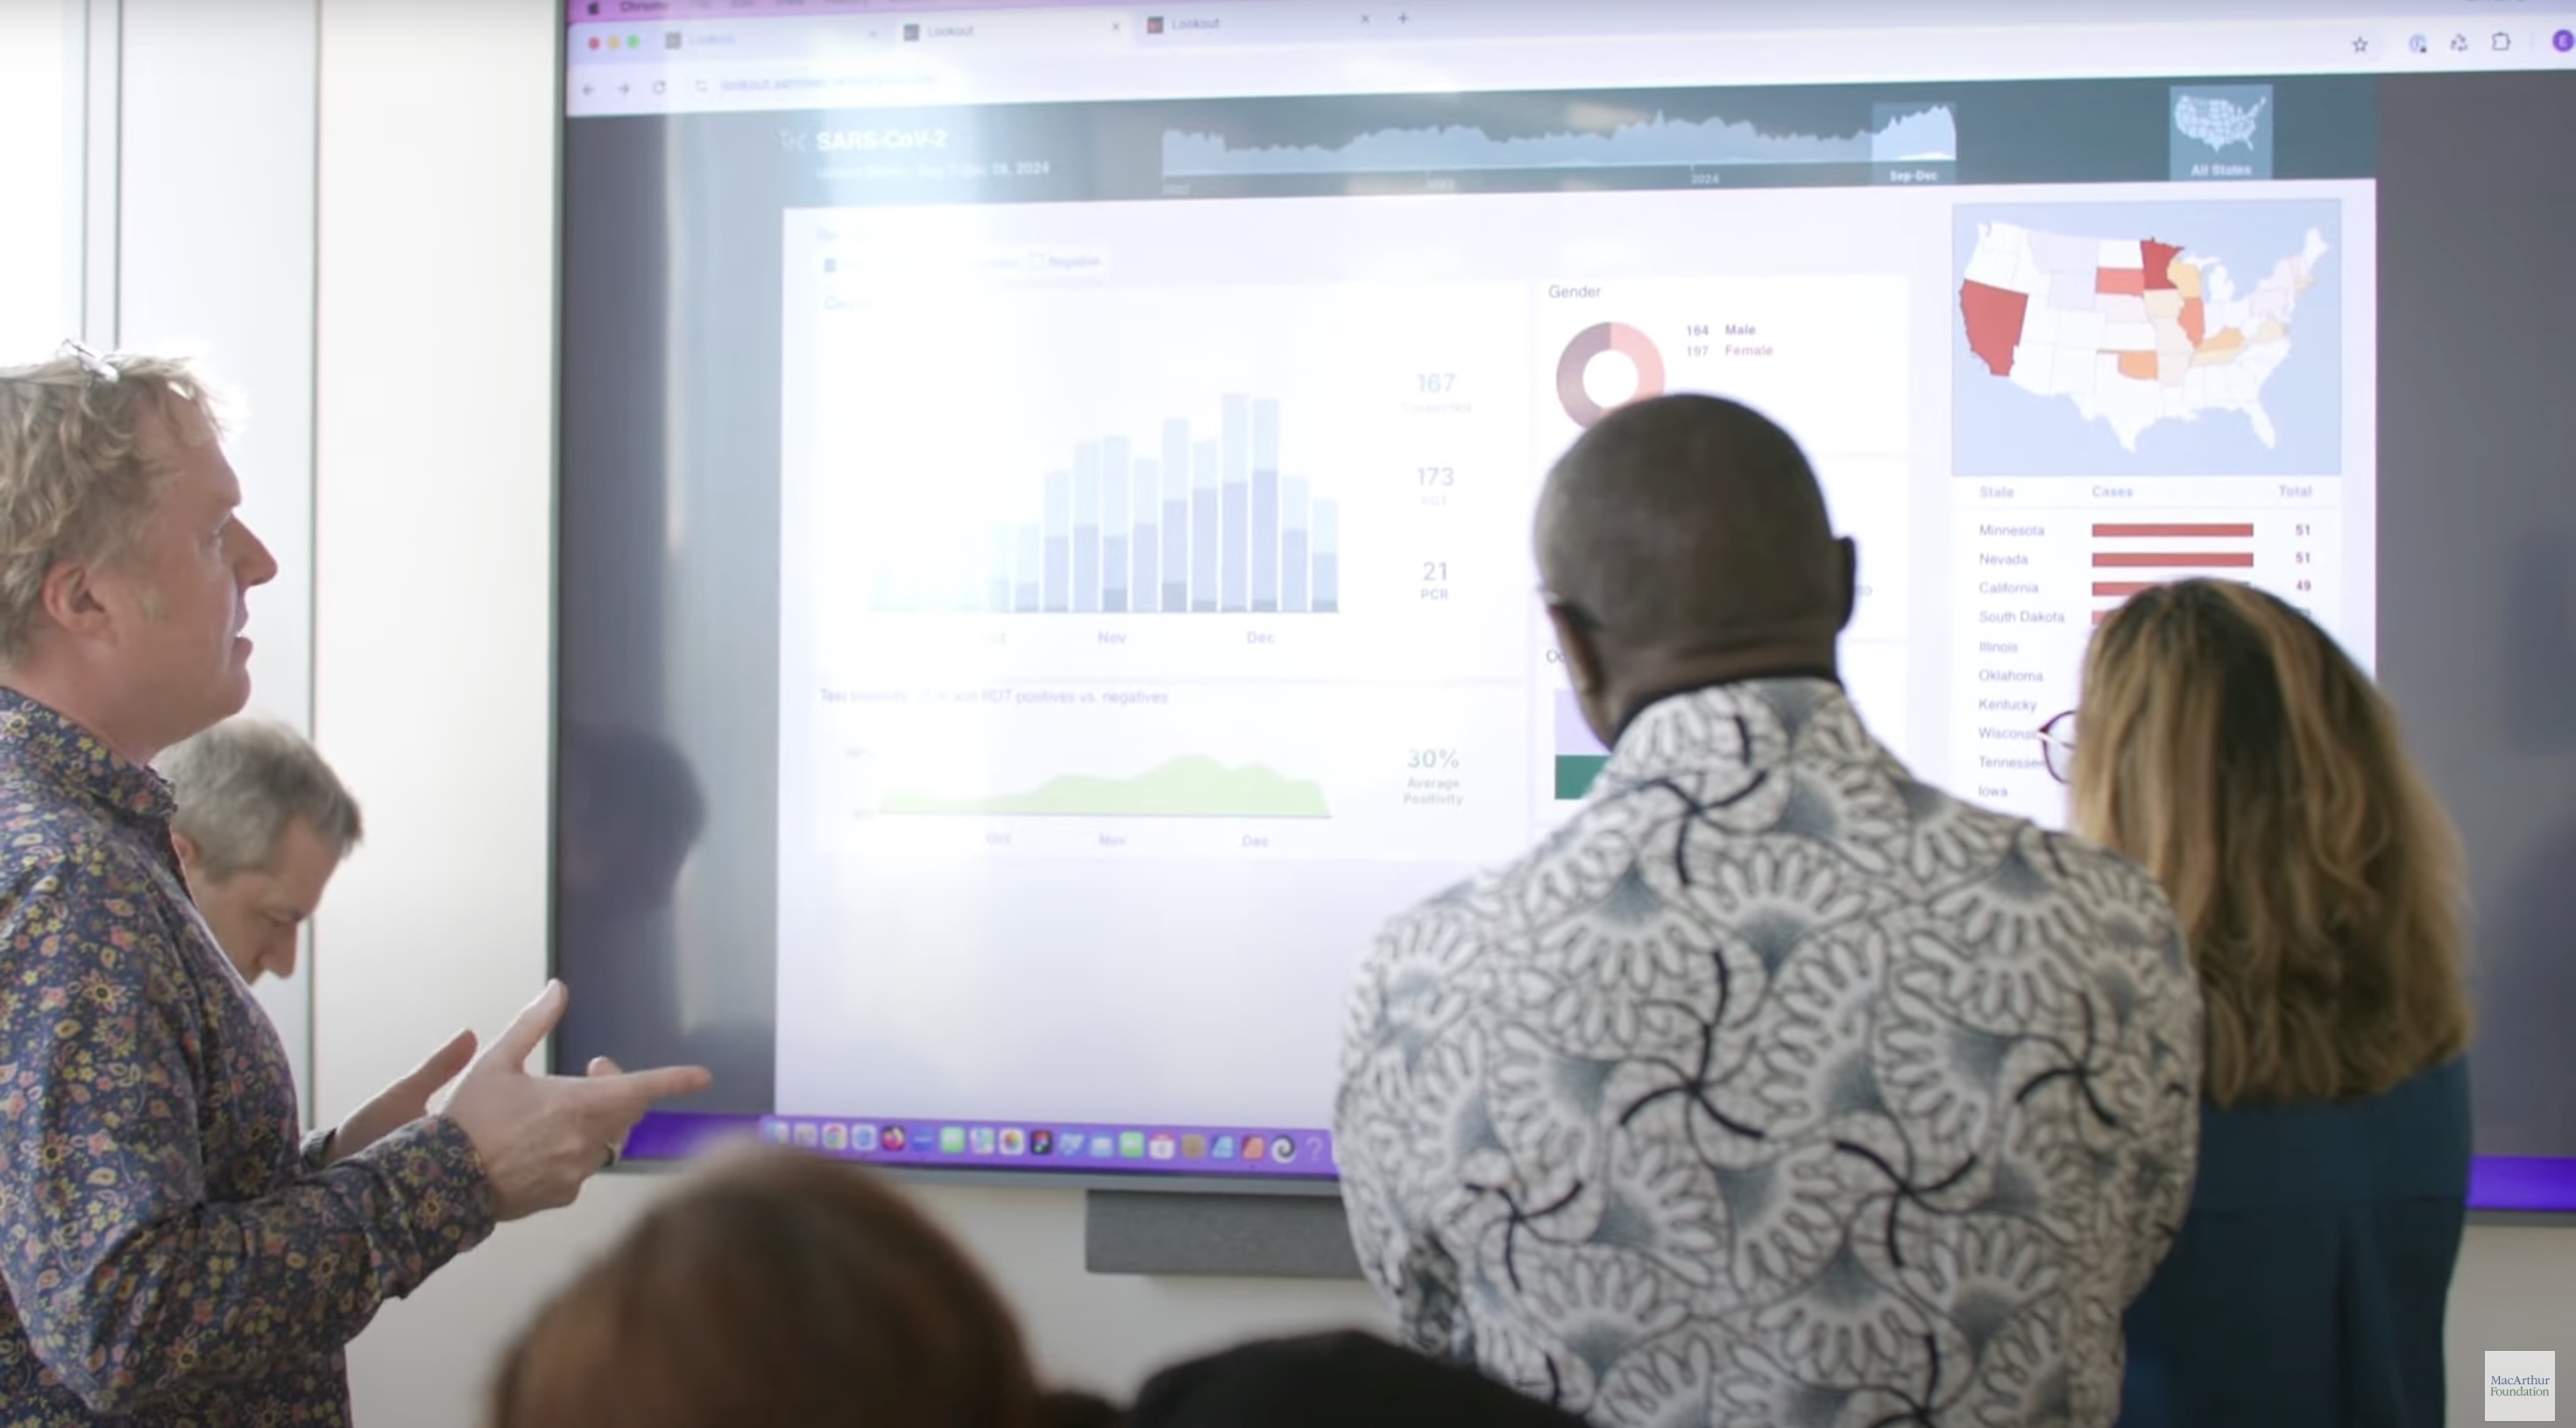
We developed Lookout from our years of experience working closely with Pardis Sabeti, Christian Happi, and the broader Sentinel team in their efforts to develop a comprehensive outbreak surveillance and response framework, but it’s always incredibly important to us to hear about all the ways in which the broader public health community engages with their data.
We would love to hear more about the ways in which you work with outbreak data and any features that would help you in your work. We hope you reach out to us at lookout@fathom.info and let us know what you think.