Displaying Your Data
Lookout allows you to choose the charts that represent your data best, and sort them into columns for organization. You can also easily set up multiple pages for different views of your data.
Each page layout is specified in its own .json file, located in site/layouts.
A layout consists of several charts arranged into columns. A basic layout file might look like this:
single-pathogen-view.json
{
  "charts": { // Specifies all the charts to be used in this layout
    "my-case-chart": { "kind": "disease", "field": "flua" },
    "my-gender-chart": { "kind": "donut", "field": "gender" },
    "my-age-chart": { "kind": "histogram", "field": "age" },
    "my-states-map": {
      "kind": "map",
      "field": "geo", // Field for geographic data in records.json
      "uri": "states.svg" // Path to map svg in site folder
    }
  },
  "columns": [ // Specifies the actual columns in the layout and which charts go where
    { "title": "Cases", "children": ["my-case-chart"] },
    { "title": "Demographics", "children": ["my-gender-chart", "my-age-chart"]},
    { "title": "Geography", "children": ["my-states-map"]}
  ]
}
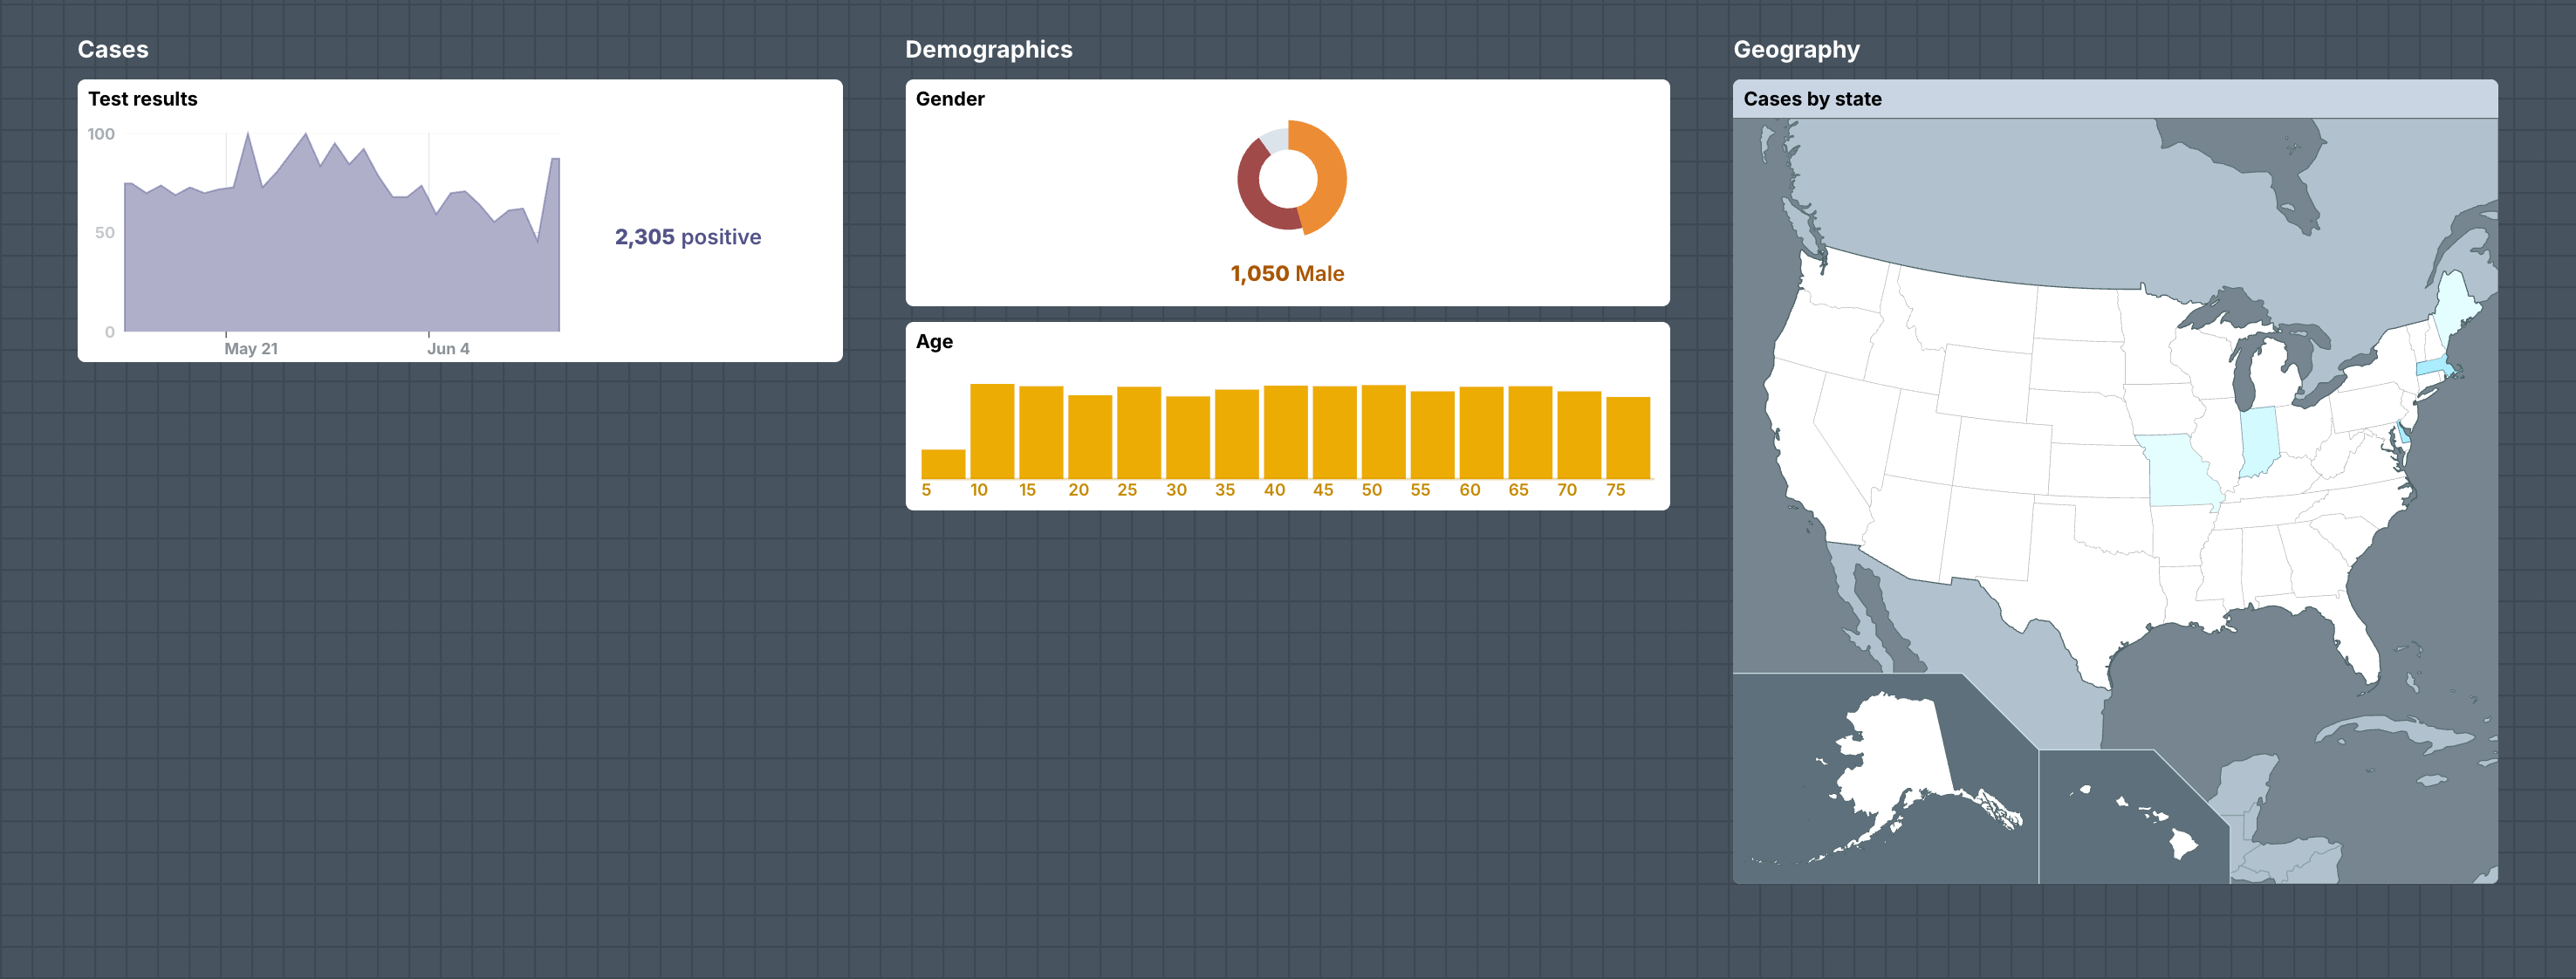
charts is a list of all the charts your site will show. columns specifies how those charts get laid out on the page.
Configure charts
- The
kindproperty decides what type of chart is used to display the data. - The
fieldproperty determines which data field fromrecords.jsonis linked to the chart. - Some kinds of chart (e.g.
map) require additional properties.
For specifications on every kind of chart, see Chart Types.
Configure columns
Build your layout by organizing your charts into columns.
- Each column must have a
title. - For a chart to appear on your page, its ID (e.g.
my-case-chart,my-states-map) must appear in a column’schildren. - Charts can be resized by appending
/<size>to itsIDwithin a column’schildren.
By default, Lookout automatically orders charts within a column. For more information about custom column layouts, such as Group Blocks, reordering charts, and changing chart heights, see the layout.json reference.
Next steps
By now, you’ve been able to play around with your Lookout site’s configuration, data, and layout! To further customize your site, you can refer to the json file references:
In particular, you might find that a multi-pathogen view is more suitable for your dataset. For instructions on setting up a multi-pathogen view, see Multi-Pathogen View.
When you want to deploy your site, you can easily integrate it into whatever server/deployment architecture your organization uses. Because Lookout sites are static bundles, they can be easily served (e.g. via a lightweight nginx server) and either kept login-protected or made public.