Displaying Maps - Map SVG
Visualizing geographic data is a core function of Lookout. We currently support choropleth maps (example below), which colors individual geographic subdivisions based on case counts. Coordinate maps are coming soon!
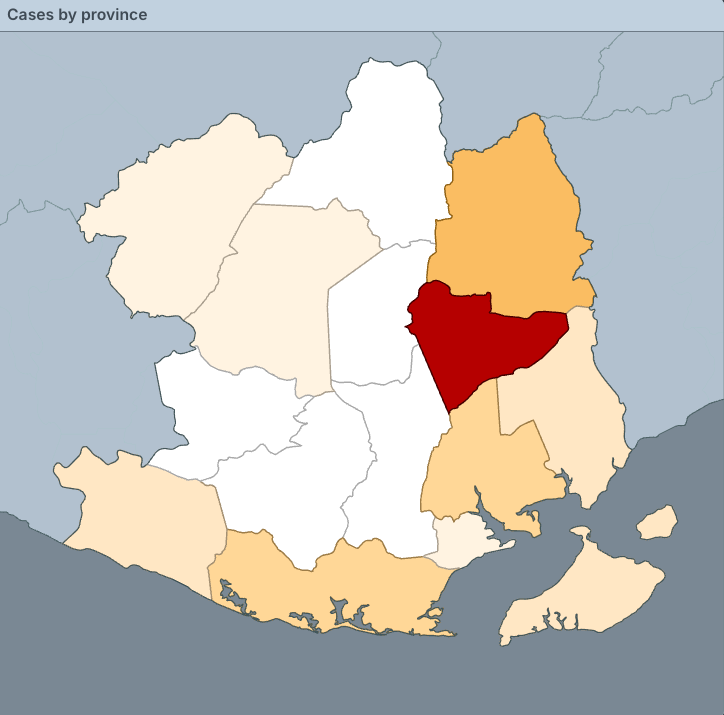
To render a map, you must include a SVG containing the desired map borders in your site folder. In your SVG, the path defining each subdivision must have id = {geographic_value}, where {geographic_value} matches a value in records.json of the geomap field.
For example, to map case counts by state for the following records:
// RECORDS.JSON
{
  {
    "flu": "positive",
    "state": "AK",
    "count": 10500
  },
  {
    "flu": "positive",
    "state": "AL",
    "count": 5000
  }
}
your SVG should contain paths with the following ids:
<path id="AK" d="..."> // path drawing state AK
<path id="AL" d="..." > // path drawing state AL
Styling your Map
To style a path in your SVG according to the Lookout system palette, assign its id to one of the following feature types. For example, if there are paths in the SVG that represent lakes, oceans, and/or rivers, setting their id="ocean" will fill them in accordingly.
| Syntax | Description |
|---|---|
entity | A primary entity of the SVG with data (a country, a state, etc.) |
subdivision | A subdivision of a primary entity (states within a country, counties within a state, etc.) |
adjacent_entity | A neighboring entity that displays no data |
adjacent_subdivision | A neighboring subdivision that displays no data |
coastline | Coastline |
ocean | Ocean or other body of water |
Your SVG does not need to contain every feature type listed.